Software Renderer Tutorial - Rasterizing Triangles
Now that we can draw pixels to the screen, the next step is to fill in a triangle on the screen. This is called rasterizing. To rasterize triangles we are going to fill in all of the pixels that are “inside” the triangle. So how do we determine what points are inside the triangle efficiently? There are plenty of algorithms that can be found online to test if a point is in a polygon but these are too slow. We need to minimize the code that runs for each pixel since this code will be run the most. We will be doing some basic vector math for this section so I have provided the base of a Point3 class below. The only functions that may need explaining are the dot2 and cross2 functions which are the dot product and cross product of only the 2d part of the 3d vector. Why we are using 3d vectors (and soon 4d vectors) for drawing to a 2d screen will become clear later but for now we can just ignore the z axis. We will add more functions and math classes as needed.
To import the math class and use it in main, add the following lines:
math.js
export default class Point3 {
	constructor(x, y, z) {
		this.x = x;
		this.y = y;
		this.z = z;
	}

	sub(p) {
		return new Point3(this.x - p.x, this.y - p.y, this.z - p.z);
	}

	add(p) {
		return new Point3(this.x + p.x, this.y + p.y, this.z + p.z);
	}

	dot2(p) {
		return this.x * p.x + this.y * p.y;
	}

	cross2(p) {
		return this.x * p.y - this.y * p.x;
	}

	clone() {
		return new Point3(this.x, this.y, this.z);
	}
}
add math.js module
<script type="module" src="math.js"></script>
import math.js
import Point3 from "./math.js";
Let’s define our inputs to help define the problem more clearly. We want to write a function that takes some sort of buffer object, 3 points, and a color and fills in the triangle on the buffer. For now we also want to only render triangles going a certain direction. We can use clockwise triangles. This seems like an arbitrary decision, but it will save us time later when we want to only show the outside faces of triangles to minimize the number of pixels we are rendering. The 3 points can be in any clockwise order so the first thing we will do is swap points around to ensure that p1 is the highest point, p1-p2 is the right segment of the triangle, and p1-p3 is the left side of the triangle.
function drawTriangle(data, p1, p2, p3, r, g, b, a) {
}
The following code rotates the vertices so that p1 has the highest y value. Notice that the clockwise or counterclockwise order of the points is maintained in the process.
	if (p2.y < p1.y && p2.y <= p3.y) {
		let tmp = p1;
		p1 = p2;
		p2 = p3;
		p3 = tmp;
	}
	if (p3.y < p2.y && p3.y < p1.y) {
		let tmp = p1;
		p1 = p3;
		p3 = p2;
		p2 = tmp;
	}
To ensure that p2 is on the right, we will simply throw out any triangles that are not counter clockwise. The cross product of the 2d vectors that run along the edges of the triangle can help us do this. The cross product has a lot of use in geometry and graphics but for this case the main property we care about is that if the second vector is rotated clockwise from the first vector, it will return a positive z value, otherwise the z value will be negative. The cross2 function I have implemented only returns the z value because the x and y values of the cross product of two 2d vectors will always be zero. If we take the cross product of p1-p2 and p1-p3 and it is positive, then we continue, otherwise, we can simply return.
	let vL = p2.sub(p1);
	let vR = p3.sub(p1);
	let cr = vL.cross2(vR);

	//keep Clockwise Faces
	//cull Counter Clockwise Faces
	if (cr < 0) {
		return;
	}
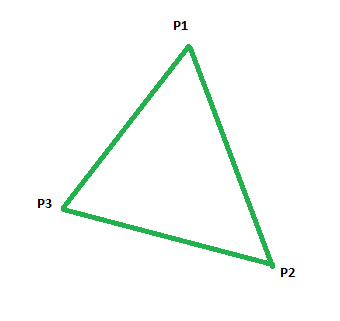
Our triangle points are in order and we can imagine them looking something like this with p1 on the top and the other points going clockwise.
To draw this triangle we will now move a scan line down the triangle and draw a line of pixels between the left and right edge of the triangle for each scan line. There are now two cases to consider. The scan line starts out expanding slowly until it reaches the second lowest point on the triangle. Then it switches back to shrinking until it hits the lowest point.
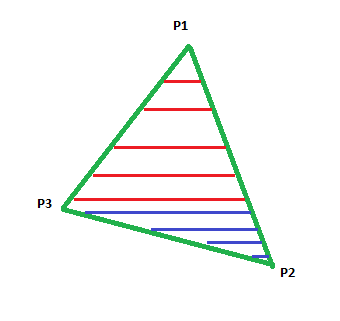
The red scan lines show the growing phase (going down in the +y direction) and the blue scan lines show the shrinking phase.
As a result, we will make a function that can draw half of the triangle at a time. We will call it “doHalfTri”. This function needs to know the top starting points, the slopes of the lines coming out of those points, and the scan line start height and scan line end height. Then we just need to call this function once for the top half and once for the bottom half of the triangle.
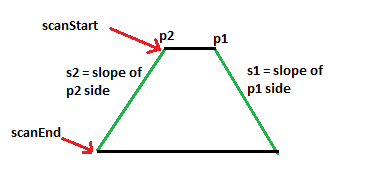
A simple for loop can draw each row of pixels if we can provide the left and right boundaries for each scan line. To calculate the lower boundary of the top scan line, we can put p2 and slope2 into point slope form and solve for the intersection with the scan line.
y - y' = (x - x') * slope
Plug in p2 for our point, and solve for the x position at the height of the scan line
(scanStart - p2.y) = (x - p2.x) * s2
(scanStart - p2.y) / s2 = (x - p2.x)
(scanStart - p2.y) / s2 + p2.x = x
To get the equation for p1 and slope1 we can simply swap them out with p2 and slope2 so there is no need to derive the equation again. Now we have a formula we can use to get the lower and upper bound for the scan line so we should be able to write that inner for loop that draws each pixel. We only want to draw pixels inside the triangle so we will take the ceiling of the two values and use a for loop to iterate from the lower value inclusive to the upper value exclusive. The upper value should not be drawn because its coordinates are outside of our triangle bounds.
![]()
Here is our half triangle function after implementing the above equations. Note that s1 and s2 are inverse slopes to simplify the equations.
function doHalfTri(data, scanStart, scanEnd, p1, slope1, p2, slope2, r, g, b, a) {
	//start right x pos
	let sx1 = p1.x + (scanStart - p1.y) * slope1;

	//start left x pos
	let sx2 = p2.x + (scanStart - p2.y) * slope2;

	//draw scan lines
	for (let i = scanStart; i < scanEnd; i++) {
		let low = Math.ceil(sx2);
		let high = Math.ceil(sx1);
		if (i >= 0 && i < data.height)  {
			for (let j = low; j < high; j++) {
				if (j >= 0 && j < data.width)  {
					setPixel(data, j, i, r, g, b, a);
				}
			}
		}
		sx1 += slope1;
		sx2 += slope2;
	}
}

function setPixel(data, x, y, r, g, b, a) {
	if (x >= 0 && y >= 0 && x < data.width && y < data.height) {
		let idx = (x + y * data.width) * 4;
		data.data[idx] += r;
		data.data[idx + 1] += g;
		data.data[idx + 2] += b;
		data.data[idx + 3] = a;
	}
}
The code above has one major difference from what we described so far. On each scan line, instead of recalculating the lower and upper bounds, it just adds the inverse slope of each bound. We can do this because as the scan line increases by 1, the result of the equation increases by the corresponding inverse slope. This is the main reason we pass in the inverse of the slope rather than the slope itself.
Putting it all together
We have all of the pieces to render a triangle. Now we just need to put them together. Our top half triangle can be drawn by passing the p1 vector in as both the left and right start point. We then need to pass in the inverse slope of p1-p2 for the right side of the triangle and the inverse slope of p1-p3 for the right side of the triangle. Our scan start would simply be the top of the triangle which is the ceiling of p1.y. Our scan stop (which is exclusive) should be the ceiling of the middle point’s y value. This could be p2 or p3 since only p1 is guaranteed to be at the top.
	let yScanStart = Math.ceil(p1.y);
	let yScanEnd = Math.ceil(Math.min(p2.y, p3.y));
	if (yScanEnd !== yScanStart) {
		let vec1 = p2.sub(p1);
		let vec2 = p3.sub(p1);
		doHalfTri(data, yScanStart, yScanEnd, p1.clone(), vec1.x/vec1.y, p1.clone(), vec2.x/vec2.y, r, g, b, a);
	}
Now there are two cases to deal with. Either p2 is the middle point or p3 is the middle point. If p2 is the middle point then we start with p1 and p2 as the lower and upper vertices, using their slopes to p3 as the slope. If p3 is the middle point then we start with p3 and p1 as the lower and upper vertices also passing in their slopes to p2. This will draw the bottom half of our triangle.
	yScanStart = yScanEnd;
	let vec1, vec2, start1, start2;
	if (p2.y > p3.y) {
		yScanEnd = Math.ceil(p2.y);
		vec1 = p2.sub(p1);
		vec2 = p2.sub(p3);
		start1 = p1;
		start2 = p3;
	} else {
		yScanEnd = Math.ceil(p3.y);
		vec1 = p3.sub(p2);
		vec2 = p3.sub(p1);
		start1 = p2;
		start2 = p1;
	}
	if (yScanStart !== yScanEnd) {
		doHalfTri(data, yScanStart, yScanEnd, start1.clone(), vec1.x/vec1.y, start2.clone(), vec2.x/vec2.y, r, g, b, a);
	}
To test your code it is best to draw triangles in many orientations so I have made a quick main loop to draw rotating triangles and give our function a test.
let val = 0;
let imageData = new ImageData(width, height);
setInterval(mainLoop, 1000/60.0)

function mainLoop() {
	val += .01;

	let a = Math.sin(val - 1.5 - Math.sin(val / 1.3538)) * 100 + 320;
	let b = Math.cos(val - 1.5 - Math.sin(val / 1.3538)) * 100 + 240;

	let c = Math.sin(val + 2) * 100 + 320;
	let d = Math.cos(val + 2) * 100 + 240;

	let e = Math.sin(val + 1) * 100 + 320;
	let f = Math.cos(val + 1) * 100 + 240;

	let g = Math.sin(val - 3.5) * 100 + 320;
	let h = Math.cos(val - 3.5) * 100 + 240;
	drawTriangle(imageData, new Point3(a, b, 0), new Point3(c, d, 0), new Point3(e, f, 0), 255, 0, 0, 255);
	drawTriangle(imageData, new Point3(a, b, 0), new Point3(g, h, 0), new Point3(c, d, 0), 0, 255, 0, 255);

	ctx.putImageData(imageData, 0, 0);
	imageData.data.fill(0);
}

setInterval(mainLoop, 1000/60.0);
Congratulations on rasterizing your first triangle! Unfortunately the triangles look a bit boring as they are all solid colors with no gradients or texture. We will fix this in the next section by adding fragment shaders that allow you to define how each pixel of a triangle looks in a simple callback function.
Full source code for this page can be found here.