Software Renderer Tutorial - Getting Started
Before we can start on the software renderer we have to have a way to draw the pixels to the screen. If you are using another language and already know how to draw pixels to the screen or a buffer, you can skip this page and go to the next section. Since we are using javascript the easiest way to draw directly to the screen is to use a canvas with an ImageData object. The goal is just to have an interface that you can send an array of RGB values and make the resulting image appear on the screen.
To keep it simple, start out by making a new folder for the project that will contain all of our html and js files that will be served statically. The html file only needs to have a canvas element. For this tutorial we will be using a 640x480 canvas. You can use whatever size canvas you want but larger canvases may cause the software renderer to become much slower since the rasterization has to happen for each pixel drawn to the screen.
Here is the initial index.html file:
<!doctype html>
<html>
<head>
  <meta charset="utf-8">
  <title>Software Renderer</title>
</head>
<body>
  <canvas id="canvas" width="640" height="480"/>
</body>
</html>
To view the result, you can just double click on the file to open it in your preferred browser. This will work for a while but does not work with modules with certain browsers so it is best to use a simple static server. You can use any server you prefer but it is easiest just to install http-server with npm.
npm install http-server -g
cd software_renderer
http-server
Now in your browser you can navigate to localhost:8080 and your index.html file will be shown.
This just produces a blank page for now. To add some color to it make a new file called main.js. This file will import the other modules and contain the main rendering loop. For now though let’s just get something on the screen.
main.js:
let canvas = document.getElementById('canvas');
let ctx = canvas.getContext('2d');
let width = canvas.width;
let height = canvas.height;

let imageData = new ImageData(width, height);

for (let i = 0; i < width; i++) {
  for (let j = 0; j < height; j++) {
    idx = (i + j * width) * 4;
    imageData.data[idx] = 255 * i / width;
    imageData.data[idx + 1] = 255 * j / height;
    imageData.data[idx + 2] = 0;
    imageData.data[idx + 3] = 255;
  }
}
ctx.putImageData(imageData, 0, 0);
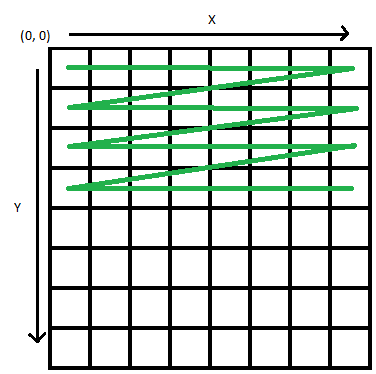
It is important to note that Javascript canvas and ImageData objects use a slightly non standard (mathematically) set of axes. The upper left corner is (0,0) and the y axis goes down (so down is positive y). The equation to get the index of the red value of a pixel in the code above is (x + (y * width)) * 4. The order of the array values can be visualized as increasing from left to right so each pixel is greater than the one on its left. Then each row is greater than the previous row. The index is multiplied by 4 because there are 4 values for each pixel. Red, Green, Blue, Alpha
To make this file part of our page, add this line to the end of the body in index.html:
<script type="module" src="main.js"></script>
When you refresh your page you should see a red and green gradient. If you don’t see any change, try ctrl-f5 to make sure the new files are loaded.
Now that we can set pixel values, we are ready to start rasterizing triangles!